About this project
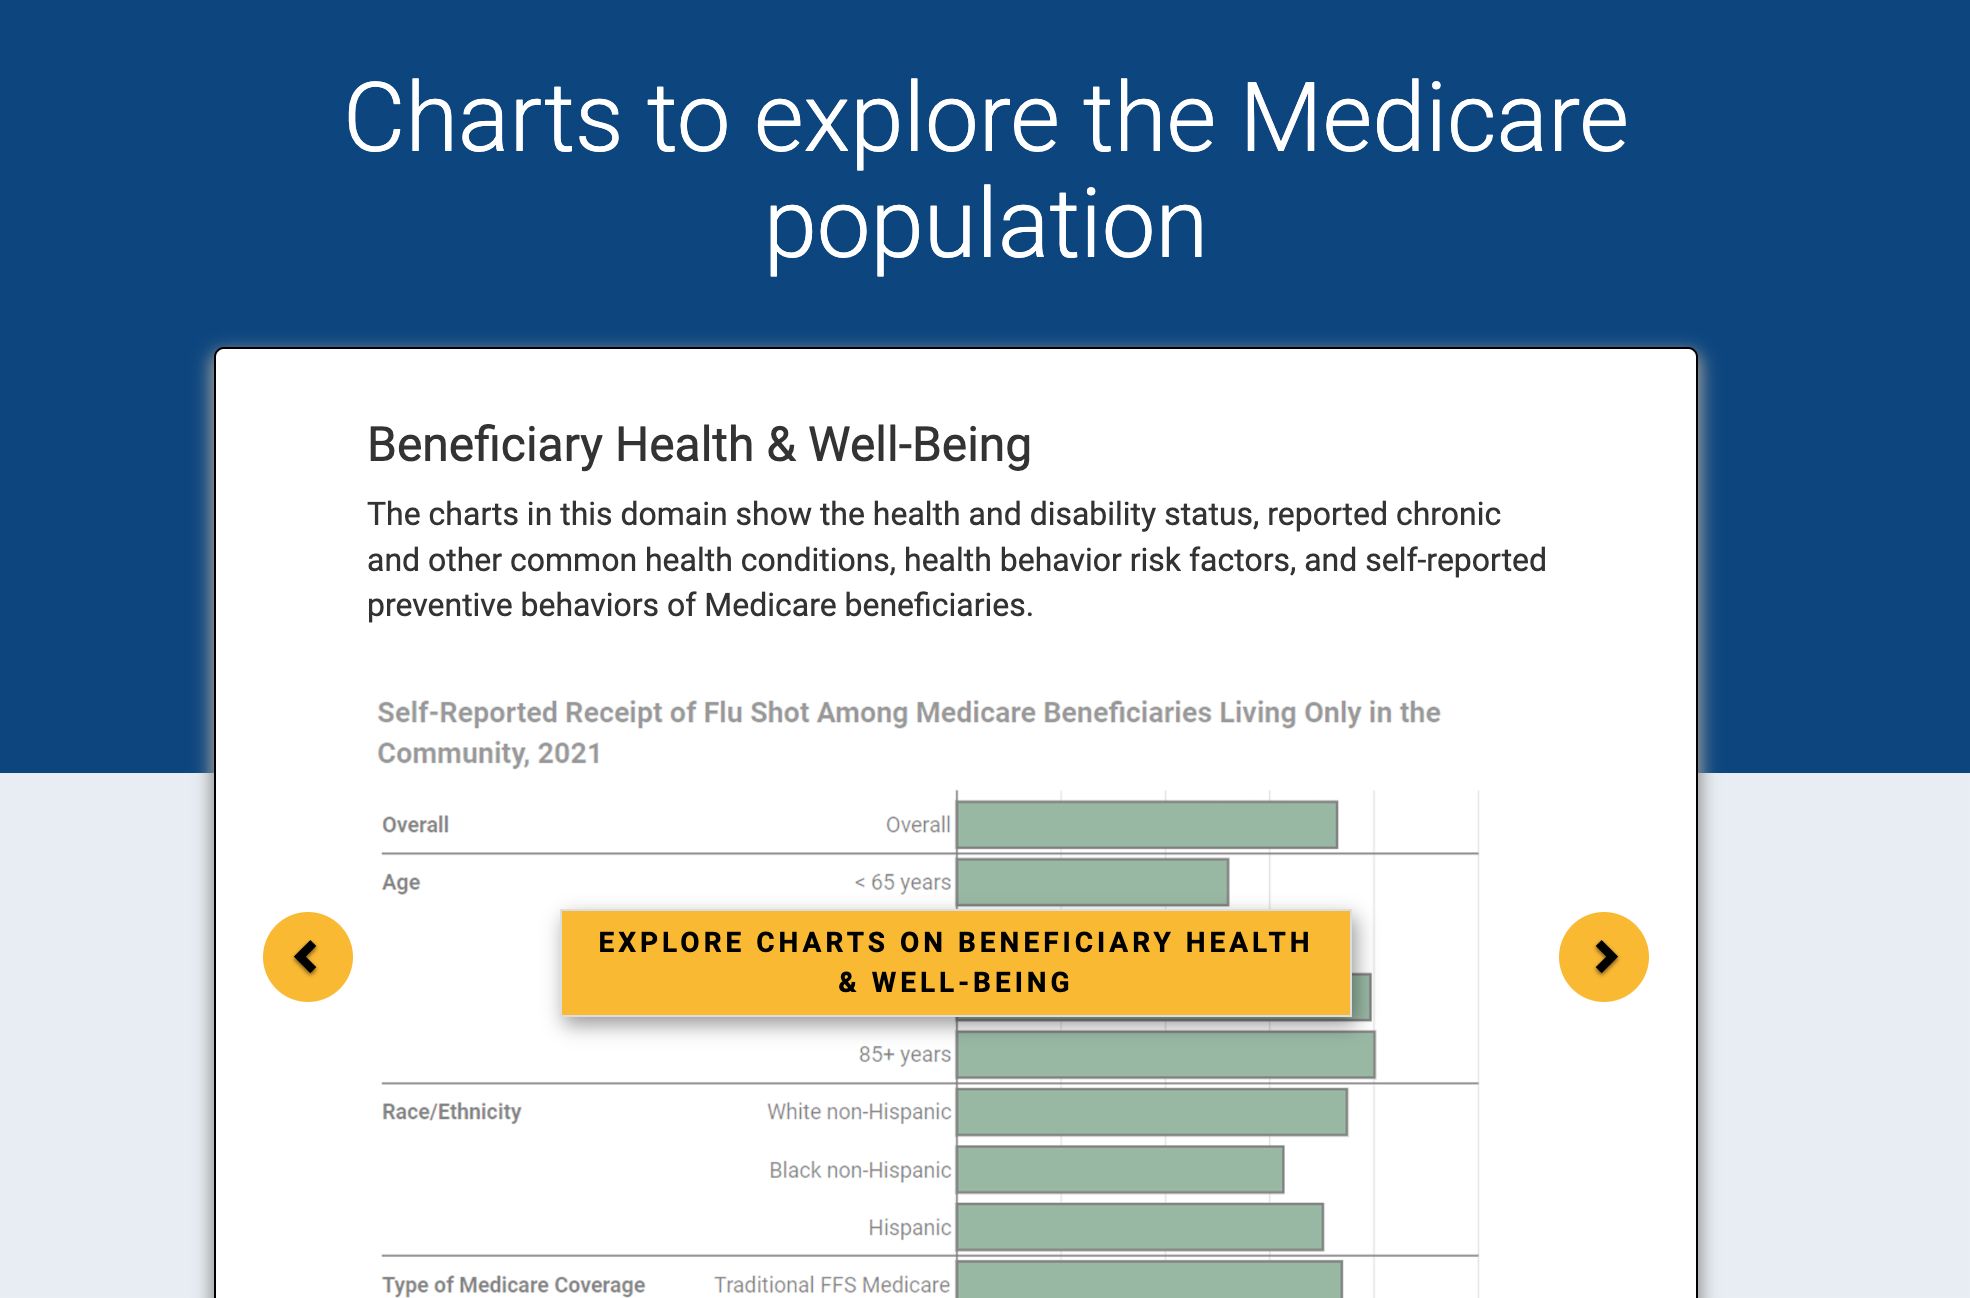
This project developed an interactive website for exploring data on the Medicare population from the Medicare Current Beneficiary Survey (MCBS). These visuals highlight the breadth and depth of the data collected in the MCBS and allow data users to visually explore patterns and relationships among the Medicare population.
There are four main domains of content in the site:
Medicare Population Overview,
Beneficiary Health & Well-Being,
Health Care Access & Satisfaction
Health Care Use & Expenditures.
Who was involved
This site was built in its entirety by my wonderful colleague Taylor Wing and me. We worked with NORC’s Communications team and our colleague Nola du Toit on the user experience and chart design, and of course our fantastic MCBS colleagues.
My role
I implemented most of the site design, including the majority of the CSS and HTML elements. Taylor created all the interactive charts and helped with data and metadata preparation.
Tools used
This entire site is a Shiny application. Charts were created in ggiraph. We leveraged the metathis package to create custom meta tags for the site.
Learn more about some of the key tools from this project by clicking on the hex.

