About this project
This site presents a series of tools to explore data on crime, fear, and police contact in the U.S. This site was a submission for the 2023 Joint Statistical Meetings (JSM) Data Challenge, which required usage of National Crime Victimization Survey (NCVS) data. Our team created a site which presents data from three different sources: NCVS, the General Social Survey (GSS), and the Police-Public Contact Survey (PPCS). Our goal was to allow people to explore the relationships between experiencing crime (NCVS), perceptions of crime (GSS), and interactions with law enforcement (PPCS).
There are four different ways to explore the data:
Read an overview story with interactive visuals about how perceptions of crime and crime victimization differ,
Explore NCVS, GSS, and PPCS measures for a specific subgroup of interest,
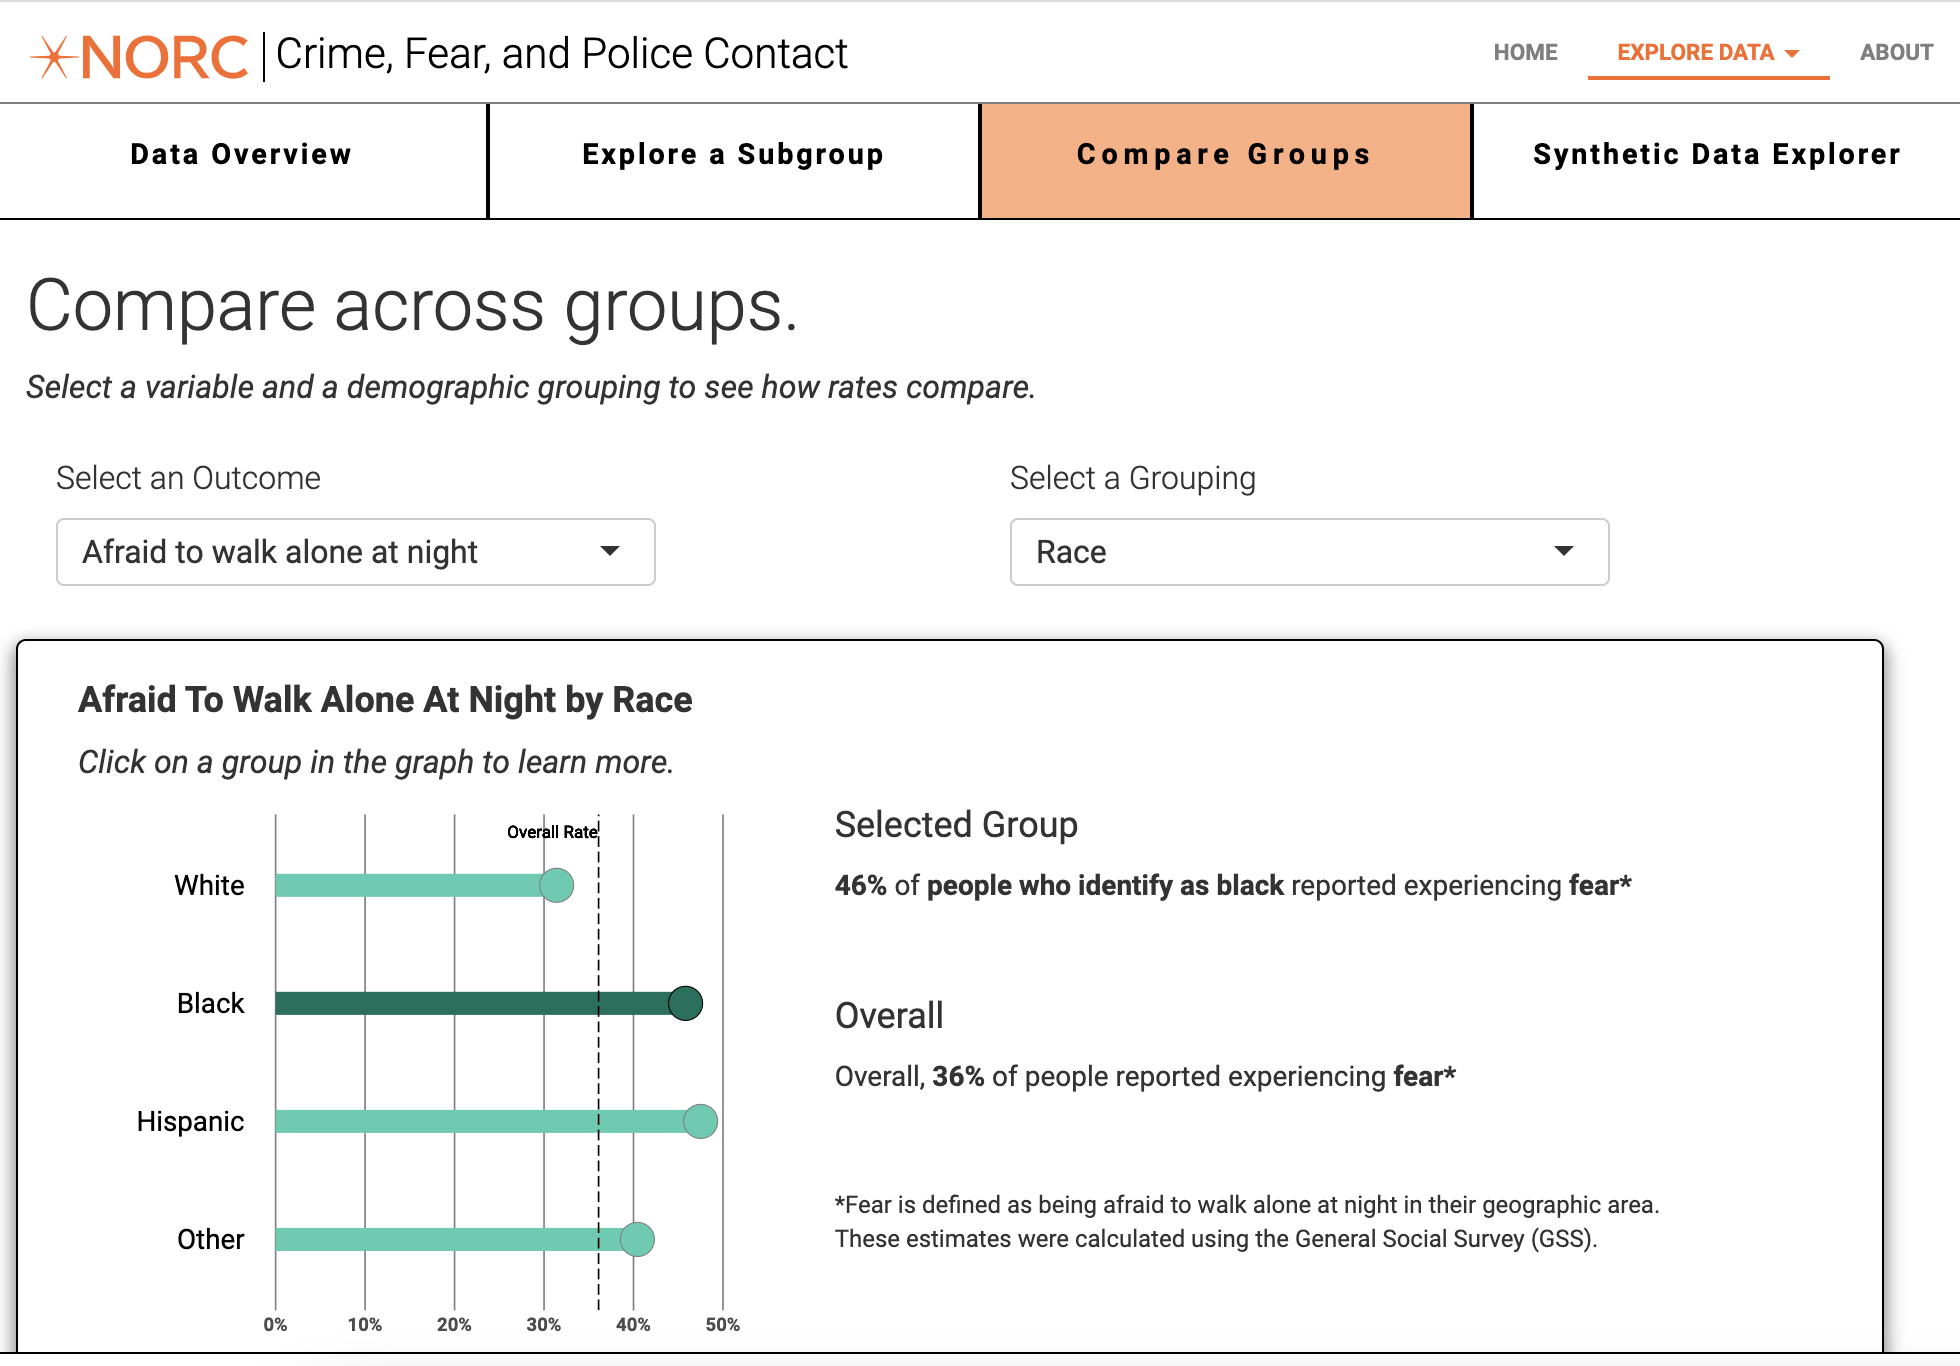
Compare groups’ experiences by race/ethnicity, age, sex, and region of the country,
Explore synthetic data which combines measures from the three surveys into one set of responses.
Who was involved
This data explorer was a collaboration between four NORC staff: me, Taylor Wing, Henry Beimers, and Anthony Washburn. Anthony was our methodological lead, determining research questions to be answered on each page and providing guidance on data labels, data processing, and interpretation. He lead the preparation of the data for the entire application. Taylor designed the ‘Compare Groups’ page, and both Taylor and Henry contributed drop-down/filter and visualization code to the site.
My role
I designed the site landing page, navigation, user experience, and three of the four visualization tabs. I built the site styling components and navigation, two of the visualization tabs, and the Home and About pages.
Tools used
The whole site is a shiny application. The team used ggiraph to build all of the interactive charts. This was another project where we heavily used glue to build out the language for tooltips/hover-overs on the interactive charts.
Learn more about some of the key tools from this project by clicking on the hex.


